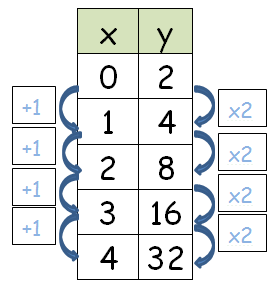
Exponential Functions
-A common factor over a common interval
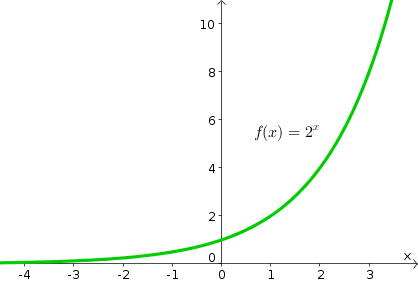
A graph of an exponential function:
Exponential Function Equation
f(x)=a*b^x/t
or
f(x)=a*b^k*x
or
f(x)=a*b^k*x
a=initial value
b=growth factor
t=interval
k=frequency
b=growth factor
t=interval
k=frequency
Growth or Decay?
Growth: a>0 and b>1
Decay: a>0 and b<1
Decay: a>0 and b<1
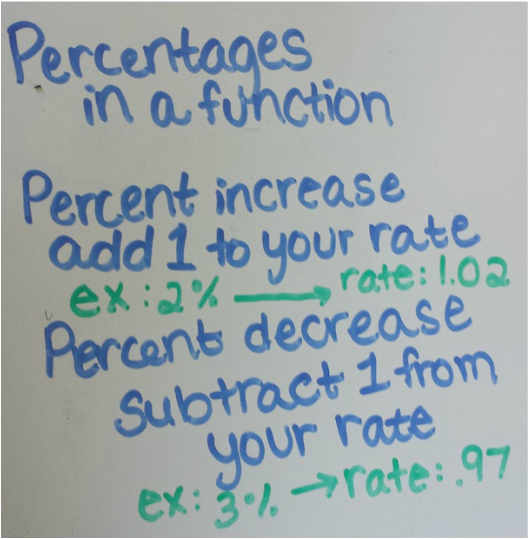
Rate
End Behavior
-the end behavior of a function: explains whether or not the function will continue in the positive/negative direction as the x-values (on the graph) continue in the positive or negative direction
As an example:
f(x)=2^x
The limit as x goes to (positive) infinity---> the function will continue in the positive direction (x=(positive) infinity)
And
The limit as x goes to negative infinity---> the function will get closer and closer to o (x=o)
If you need more help with end behavior visit---> the Polynomial page
Domain and Range
- x and y values
As an example:
f(x)=2^x
Domain: all real numbers---there is no vertical asymptote or invalid input
Range: y>0---Horizontal Asymptote at 0
Need more help?---> Go to the Functions page
As an example:
f(x)=2^x
Domain: all real numbers---there is no vertical asymptote or invalid input
Range: y>0---Horizontal Asymptote at 0
Need more help?---> Go to the Functions page
Asymptotes
-a value on graph in which the function will get very close to it, but will never reach it
Vertical Asymptote- Based on the x-values (domain)
Horizontal Asymptote- Based on the y values (range)
Vertical Asymptote- Based on the x-values (domain)
Horizontal Asymptote- Based on the y values (range)
Need more help? ---> Go to Polynomial Functions page
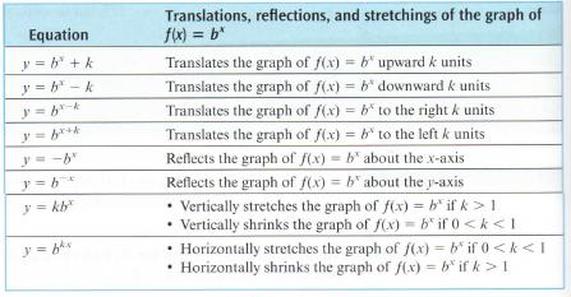
Transformations
Regressions
-a line that makes the residuals of a line as small as possible
To Find the Exponential Regression with a Calculator:
Step 1: Press 2nd and Stat Plot--- turn Plot 1 on, make sure the type of plot is scatter, the x-list is L1, and the y-list is L2
Step 2: Press stat and go to edit--- Enter all the x values (from the table you have) into L1 and all the y values (from the table you have) into L2
Step 3: Exit out of that and make sure your window for your calculator is in the correct position
Step 4: Press stat and go to calf--- Press ExpReg
Step 5: Enter in: L1,L2,Y1
(to get Y1: Press VARS, go to Y-Vars, go to function, and press Y1---this means the regression will be stored in Y=)
Step 6: Press enter and graph---the regression will appear
To See the Regression equation--- Press Y=
Questions:
#1: Construct an exponential equation with an inital value of 1 and a rate of 4 every day.
#2:Graph this function: 2*5^x and state the domain and range.
#3: construct an exponential equation with transformations (at least 3).
Answers:
Question #1
#2:Graph this function: 2*5^x and state the domain and range.
#3: construct an exponential equation with transformations (at least 3).
Answers:
Question #1
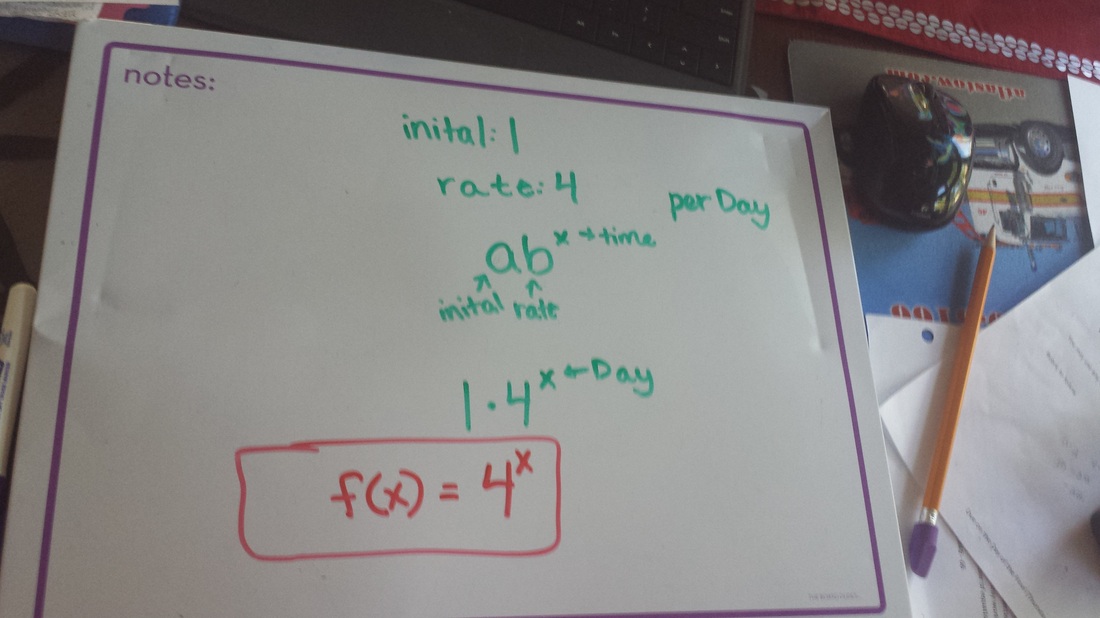
Answer above.
Question #2
Question #2
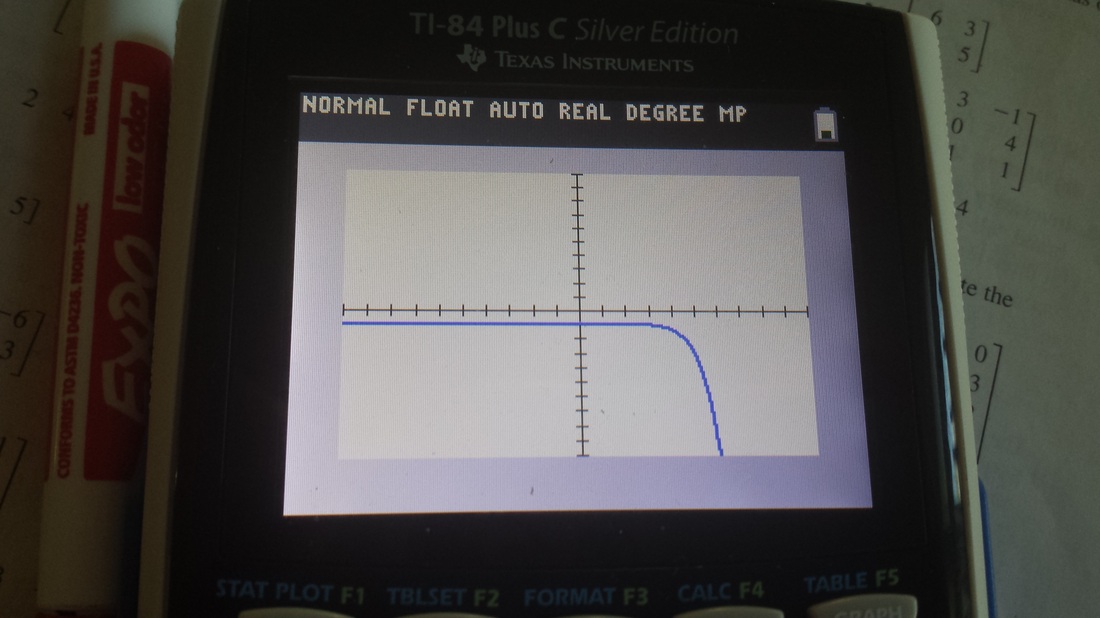
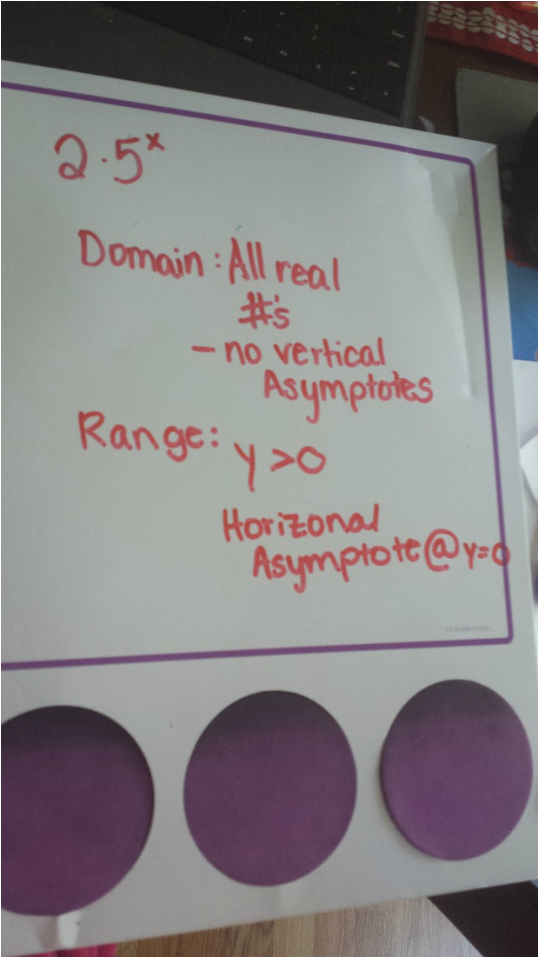
Answer above.
Question #3
Question #3
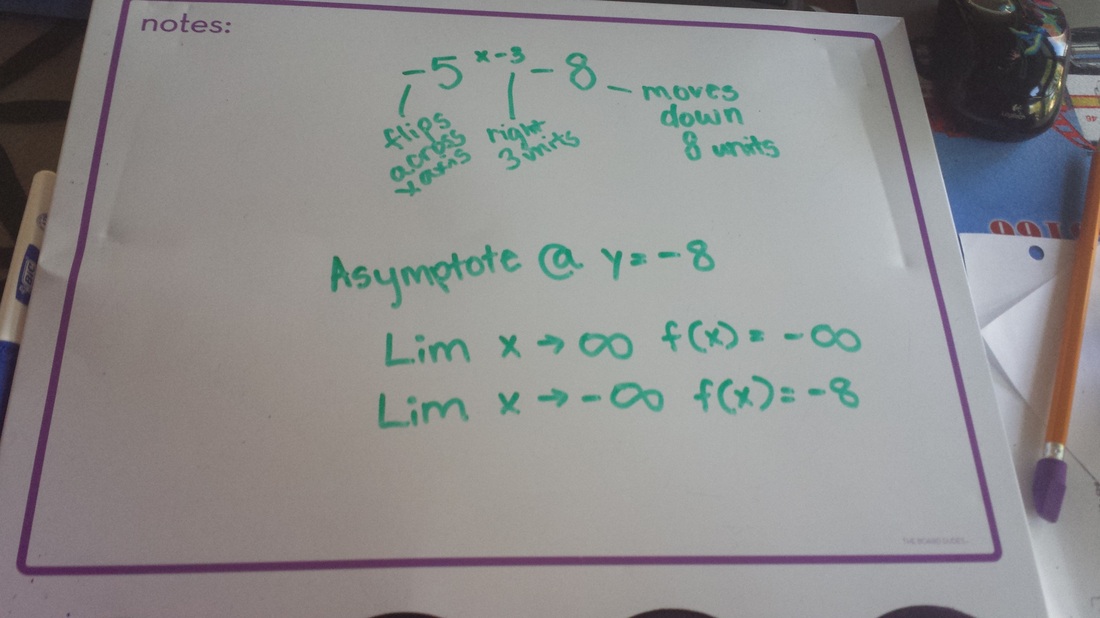
Answer above.
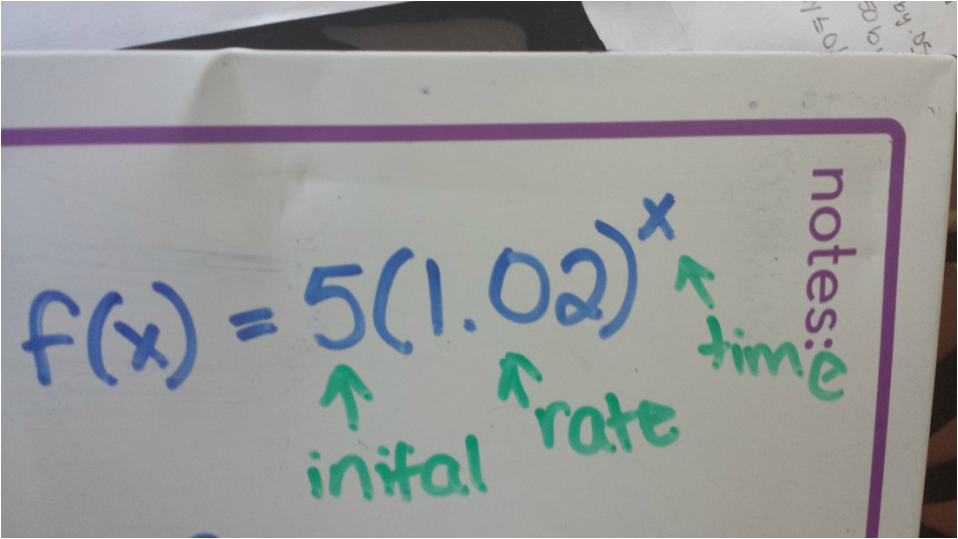
Common Core:
Construct an exponential (growth) function with this detail: initial-5 Percent growth-2%
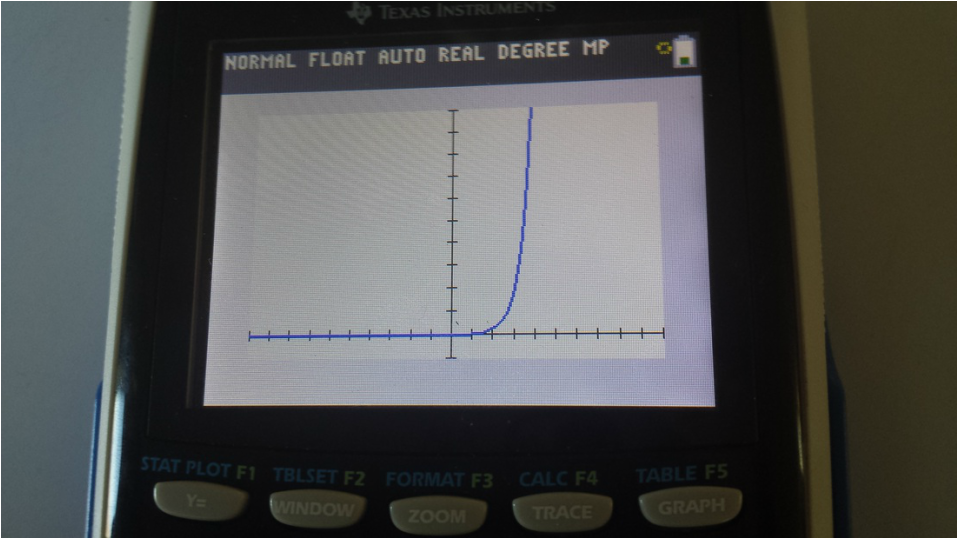
--->Graph this function
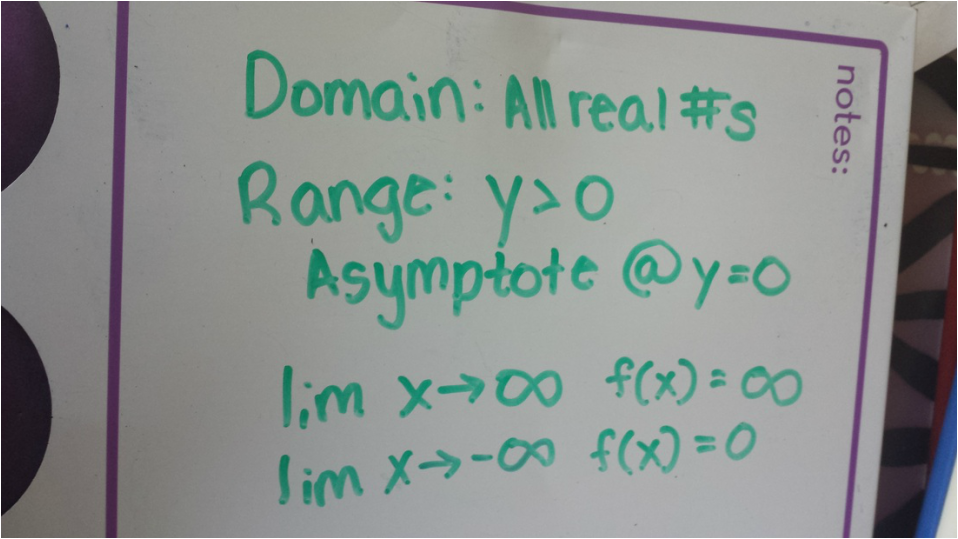
--->State the function's domain, range, end behavior, and asymptote(s)
Answers:
--->Graph this function
--->State the function's domain, range, end behavior, and asymptote(s)
Answers:
Answer above. (used exponential function)
Graph:
Graph:
Answers above.
Step 1: Evaluate the Graph
Step 2: Is there a vertical asymptote in the graph? (no, all real #'s)
Step 3: Is there a horizontal asymptote in the graph? Is the function cross the x axis? (yes, there is a asymptote @ y=0)
Step 4: As the function goes to positive infinity is it heading in the positive or negative direction? (positive)
As the function goes to negative infinity is it heading in the positive or negative direction? (gets closer and closer to 0 because of the asymptote)
